2018-9-19 15:11| 发布者: joejoe0332| 查看: 584| 评论: 0|原作者: oschina|来自: oschina
matplotlib 3.0.0 稳定版已发布,新版本要求 Python 3 以上。至于 Python 2.x ,Matplotlib 2.2.x 将作为 LTS 版本继续维护,直到 2020年1月1日。
matplotlib 是一个 Python 2D 绘图库,它提供了一整套和 matlab 相似的命令 API,十分适合交互式地进行制图。而且也可以方便地将它作为绘图控件,嵌入 GUI 应用程序中。
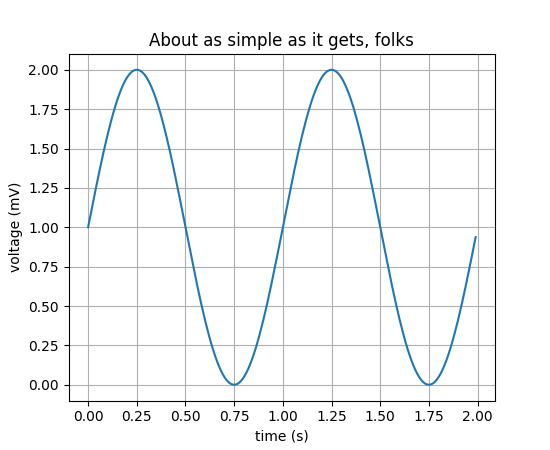
简单示例
(Source code、png、pdf)
What's new in Matplotlib 3.0
Improved default backend selection
Cyclic colormaps
Ability to scale axis by a fixed order of magnitude
Add AnchoredDirectionArrows feature to mpl_toolkits
AnchoredDirectionArrows
Add minorticks_on()/off() methods for colorbar
minorticks_on()/off()
Colorbar ticks can now be automatic
Don't automatically rename duplicate file names
Legend now has a title_fontsize kwarg (and rcParam)
Support for axes.prop_cycle property markevery in rcParams
Multipage PDF support for pgf backend
Pie charts are now circular by default
Add ax.get_gridspec to SubplotBase
ax.get_gridspec
SubplotBase
Axes titles will no longer overlap xaxis
New convenience methods for GridSpec
Figure has an add_artist method
add_artist
:math: directive renamed to :mathmpl:
:math:
:mathmpl:
具体细节可查阅发行说明和用户指南。
: 看着牙疼!
关于LUPA|人才芯片工程|人才招聘|LUPA认证|LUPA教育|LUPA开源社区 ( 浙B2-20090187 浙公网安备 33010602006705号 )


